Influence of Anti-Seismic Tooling on the Natural Frequency of Nuclear Power Valves
Oct 29, 2024
On this page
The natural frequency is an inherent characteristic of nuclear power valves. It is independent of the magnitude of the external force and depends only on the valve’s structural stiffness, mass distribution, and boundary fixing conditions. When an external load is applied at a frequency close to the valve body's natural frequency, the mechanical structure generates dynamic stress far greater than the external load itself, leading to great deformations and loss of functionality. This phenomenon is known as resonance. Most resonances are harmful, especially in environments like nuclear power plants, which require stable operation. Therefore, resonance must be avoided as much as possible when designing nuclear power valves. Frequencies that can cause resonance in nuclear power valves typically occur below 33 Hz, so valves with a natural frequency greater than 33 Hz are considered rigid. To ensure the structural rigidity of nuclear power valves, the design must first be confirmed through theoretical calculations and analysis, followed by verification through testing of the actual valves.
When calculating and analyzing the natural frequency of valves, theoretical calculation methods or finite element analysis (FEA) methods can be used. When conducting natural frequency measurement tests, either the knocking method or the sweeping frequency method is typically used. Once the valve structure design is completed, testing is required. By this stage, the structural stiffness and mass distribution of the valve have already been determined. The only factor that can still affect the natural frequency test results is the boundary support condition. During the test, the valve is directly connected to seismic tooling, which directly determines the valve’s boundary support condition. Thus, the design of seismic tooling is particularly critical. The seismic tooling should closely simulate the valve’s installation method in the nuclear power plant to ensure test effectiveness, and its structural stiffness must be reinforced to avoid weakness that could distort the measurement results.
When calculating and analyzing the natural frequency of valves, theoretical calculation methods or finite element analysis (FEA) methods can be used. When conducting natural frequency measurement tests, either the knocking method or the sweeping frequency method is typically used. Once the valve structure design is completed, testing is required. By this stage, the structural stiffness and mass distribution of the valve have already been determined. The only factor that can still affect the natural frequency test results is the boundary support condition. During the test, the valve is directly connected to seismic tooling, which directly determines the valve’s boundary support condition. Thus, the design of seismic tooling is particularly critical. The seismic tooling should closely simulate the valve’s installation method in the nuclear power plant to ensure test effectiveness, and its structural stiffness must be reinforced to avoid weakness that could distort the measurement results.
The valve design is based on a nuclear power valve prototype, and SolidWorks was used for modeling. Some non-essential parts were simplified, and the completed three-dimensional model is shown in Figure 1.
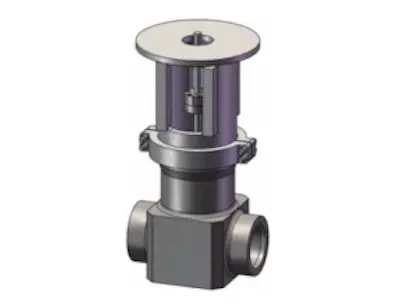
Figure 1 Three-dimensional model of valves
Initially, the valve undergoes modal analysis. The Modal module in Ansys is selected, and the contact state of the parts is set to the default bonded condition. After meshing, the valve model consists of 93,676 elements and 211,282 nodes. Since the valve is installed with butt welding at both ends, the boundary condition applies fixed supports at both ends. The analysis primarily focuses on the first-order natural frequency, which is the lowest natural frequency. The first six natural frequencies are listed here for comparison. The first six natural frequencies and the first-order vibration mode diagram are presented in Table 1 and Figure 2, respectively. The seismic tooling used for the valve's natural frequency test is a standard angle iron structure, as shown in Figure 3. This type of tooling provides sufficient structural support. Reinforcing ribs are added at the corners of the angle iron to further enhance the tooling's strength.
Table 1 Valve natural frequency
| Order | Natural frequency/Hz | ||
| Valve | Valve-Flange | Valve-Tooling | |
| 1 | 43.546 | 43.296 | 40.762 |
| 2 | 44.620 | 43.673 | 42.338 |
| 3 | 71.788 | 70.754 | 70.516 |
| 4 | 84.129 | 83.622 | 84.973 |
| 5 | 244.130 | 237.120 | 204.790 |
| 6 | 244.860 | 243.790 | 243.230 |
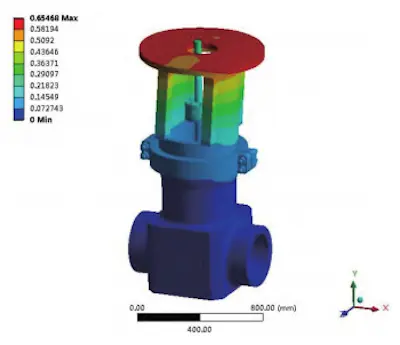
Figure 2 Valve first-order vibration mode diagram
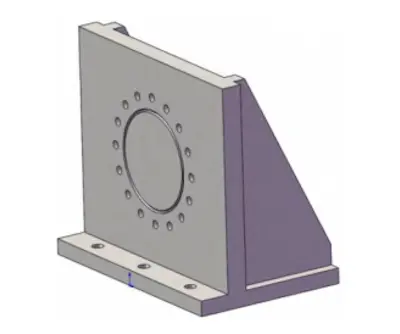
Figure 3 Anti-seismic tooling
To facilitate disassembly and assembly during the test, the connection structure between the valve prototype and the tooling uses a flange connection, with a metal gasket provided for testing. Therefore, it is necessary to temporarily modify the end connection of the valve from the original butt-welded structure to a flange connection. Here, the same method is used to perform a modal analysis on the valve body with a flange connection. The difference is that for the end connection setup, a fixed support is applied at the metal sealing ring groove, and a frictionless constraint is applied at the flange bolt hole. The first six natural frequencies and the first-order vibration mode diagram are shown in Table 1 and Figure 4, respectively. Through analysis and calculation, the natural frequencies and vibration mode diagrams of the valve body for both connection methods were obtained. Comparing the first six natural frequencies in Table 1 shows that the results for both the flange connection method of the prototype and the actual butt-welded connection method are similar, with an error margin within 1%. Comparing the first-order vibration mode diagrams in Figures 2 and 4 shows that the weak direction is along the X-axis and remains unchanged.
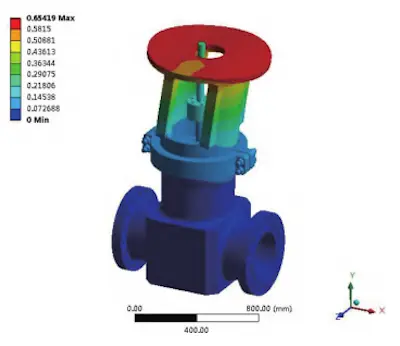
Figure 4 First-order vibration mode diagram of valve-flange
Based on the above analysis results, the valve-flange is connected to the seismic tooling to create the valve-tooling model. The specific structure is shown in Figure 5. This model closely resembles the actual test object. At this stage, the valve-tooling model is subjected to modal analysis. The end connection setup here follows a similar selection principle as the valve-flange. The bottom surfaces of the two seismic toolings are assigned fixed supports, while the anchor bolt holes are given frictionless constraints. The first six natural frequencies and the first-order vibration mode diagrams are shown in Table 1 and Figure 6, respectively.
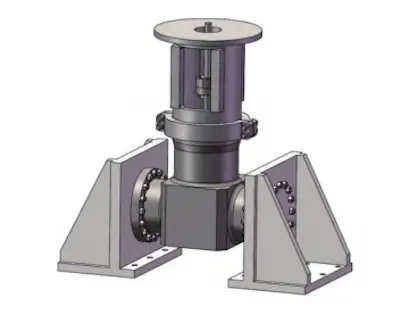
Figure 5 Three-dimensional model of valve-tooling
In the case of the tooling, the analysis results show a change, with the minimum natural frequency decreasing by about 6%. From the first-order vibration mode diagram, it can be observed that after adding the tooling, the weak direction shifts to the Z direction. The reason is that the actual measured value of the valve-tooling natural frequency reflects the connection between the valve and the tooling. The structural stiffness of both the valve and the tooling will affect each other. Since the structure of the seismic tooling itself cannot be completely rigid, the measured test value will be more conservative, which is normal. In the revised first-order vibration mode diagram, the weak direction of the valve-tooling is observed to be in the Z direction. When analyzed separately, the weak direction of the valve is consistently in the X direction. This suggests that the weak direction of the angle iron tooling is in the Z direction. Subsequent tooling optimization can begin from this perspective. Due to the influence of the tooling, the overall natural frequency changes, making the test results more conservative, as the Z direction is not currently the valve's weak direction.
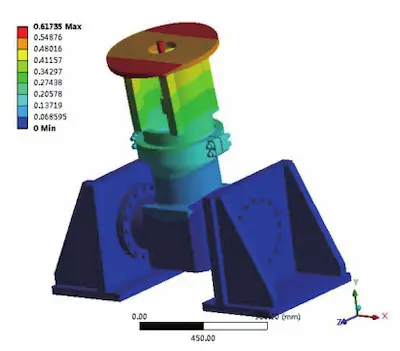
Figure 6 First-order vibration mode diagram of valve-tooling

Figure 5 Three-dimensional model of valve-tooling
In the case of the tooling, the analysis results show a change, with the minimum natural frequency decreasing by about 6%. From the first-order vibration mode diagram, it can be observed that after adding the tooling, the weak direction shifts to the Z direction. The reason is that the actual measured value of the valve-tooling natural frequency reflects the connection between the valve and the tooling. The structural stiffness of both the valve and the tooling will affect each other. Since the structure of the seismic tooling itself cannot be completely rigid, the measured test value will be more conservative, which is normal. In the revised first-order vibration mode diagram, the weak direction of the valve-tooling is observed to be in the Z direction. When analyzed separately, the weak direction of the valve is consistently in the X direction. This suggests that the weak direction of the angle iron tooling is in the Z direction. Subsequent tooling optimization can begin from this perspective. Due to the influence of the tooling, the overall natural frequency changes, making the test results more conservative, as the Z direction is not currently the valve's weak direction.

Figure 6 First-order vibration mode diagram of valve-tooling
The valve-tooling boundary setting discussed in Section 2.2 represents the most ideal state, where the bottom of the seismic tooling is fully in contact with the ground and subjected to uniform force; however, this is impossible in actual test conditions. The bolt distribution at the bottom of a single seismic tooling is shown in Figure 7. There are nine anchor bolt holes evenly distributed at the bottom of a single tooling for installing anchor studs. Most of the remaining area cannot directly provide preload, making it overly conservative to apply a fixed support across the entire bottom of the tooling.
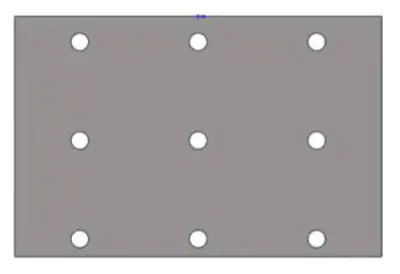
Figure 7 Bolt distribution at the bottom of the tooling
Therefore, it is necessary to incorporate the influence of bolt load into the calculation and analysis of the valve-tooling natural frequency and optimize the design accordingly. After adding the bolt load, the vertical stress distribution at the bottom of the tooling is depicted in Figure 8. The stressed area is confined to the region around the bolt load, while most other areas remain unstressed. If the tooling and test base are not perfectly flat, the actual connection stiffness between the two will be more conservative than indicated by the analysis. In this case, the boundary setting at the bottom of the tooling is adjusted based on the actual stress range. Four bolt loads were selected for analysis control: 130.95kN, 178.57kN, 226.19kN, and 273.81kN. The selection principle is based on converting the rated tightening torque of the bolt using the tightening torque formula.
T = KFd (3)
Where T is tightening torque. K is tightening torque coefficient. F is preload force, and
d is nominal thread diameter.
The two larger bolt load values represent the upper and lower limits of the tightening torque range required for the actual bolt, while the two smaller bolt loads are selected based on the arithmetic difference between the two larger values. Conduct the modal analysis with prestress. Apply the bolt load to the tooling. Record and compare the first-order natural frequency. The results are presented in Table 2 and Figure 9.
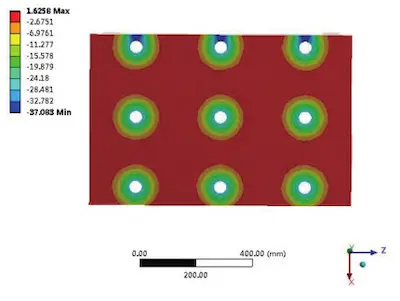
Figure 8 Stress distribution at the bottom of the tooling
Table 2 Bolt load natural frequency

Figure 7 Bolt distribution at the bottom of the tooling
Therefore, it is necessary to incorporate the influence of bolt load into the calculation and analysis of the valve-tooling natural frequency and optimize the design accordingly. After adding the bolt load, the vertical stress distribution at the bottom of the tooling is depicted in Figure 8. The stressed area is confined to the region around the bolt load, while most other areas remain unstressed. If the tooling and test base are not perfectly flat, the actual connection stiffness between the two will be more conservative than indicated by the analysis. In this case, the boundary setting at the bottom of the tooling is adjusted based on the actual stress range. Four bolt loads were selected for analysis control: 130.95kN, 178.57kN, 226.19kN, and 273.81kN. The selection principle is based on converting the rated tightening torque of the bolt using the tightening torque formula.
T = KFd (3)
Where T is tightening torque. K is tightening torque coefficient. F is preload force, and
d is nominal thread diameter.
The two larger bolt load values represent the upper and lower limits of the tightening torque range required for the actual bolt, while the two smaller bolt loads are selected based on the arithmetic difference between the two larger values. Conduct the modal analysis with prestress. Apply the bolt load to the tooling. Record and compare the first-order natural frequency. The results are presented in Table 2 and Figure 9.

Figure 8 Stress distribution at the bottom of the tooling
Table 2 Bolt load natural frequency
| Bolt load (kN) | First order natural frequency (Hz) |
| 130.95 | 38.38 |
| 178.57 | 38.82 |
| 226.19 | 38.932 |
| 273.81 | 39.017 |
| Stiffness | 40.762 |
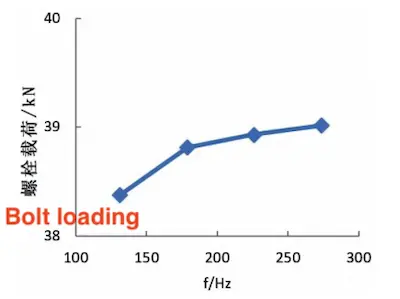
Figure 9 Trend of first-order natural frequency
The influence of bolt load on the first-order natural frequency is evident. Increasing the bolt load helps improve the overall stiffness in both directions, but the effect of bolt load remains limited. Even when the bolt is subjected to its maximum load, the first-order natural frequency is about 5% lower than the theoretical rigid connection state. In the actual test, bolt loads of 130,950N and 226,190N were selected for testing. The tapping method was used in the test, and the weak direction was consistent with the analysis results, both occurring in the Z direction. The minimum natural frequencies were 33.10 Hz and 34.56 Hz, respectively. Although there was some deviation from the analysis results, the trend remained consistent. Increasing the bolt load at the test boundary effectively improved the overall stiffness of the test object.
Previous: Selection of Butterfly Valves for LNG Receiving Stations
Next: Designing High-Pressure Cryogenic Ball Valves for LNG Devices

