Improvement in High-Pressure Slab Gate Valve Performance
Dec 30, 2024
This study examines the sealing performance and improvement for the DN300 parallel gate valve (900LB class), using experimental data and finite element numerical simulations. The results show that, prior to the modifications, fluid pressure within the valve cavity acted on the single gate plate once the valve was opened, causing vibrations that led to erosion of the sealing surface and deviations in concentricity, ultimately resulting in leakage during extended use. After the modifications, the gate plate was redesigned as a multi-component structure, incorporating a fixed guide plate and an S-type spring to maintain concentricity and reduce fluid impact, ensuring proper sealing and preventing leakage, thus guaranteeing the reliable operation of the pipeline system. These findings provide valuable guidance for optimizing gate plate structures and enhancing sealing performance, while also serving as a reference for designing similar pipeline products.
Gate valves, essential components of pipeline systems, are widely utilized in industries such as energy, chemicals, thermal power, and water management, primarily for their cut-off functionality. However, internal leakage of gate valve seals often occurs under varying operating conditions, leading to significant pipeline losses. There is limited research on the stability and reliability of gate valve seals. This study employs finite element numerical simulations and life-cycle testing analysis to improve the sealing surface performance of a DN300 slab gate valve (900LB class) developed for a project in Shaanxi Province.
This study constructs a three-dimensional model of a slab gate valve to analyze the impact of fluid flow on the plate seal when the valve is fully open (Figure 1). Figure 2 shows the plate's design before the improvement. To simulate real-world conditions, the fluid is modeled as turbulent, and straight pipes, extending 5 and 10 times the valve's inlet and outlet diameters, respectively, are added to enhance measurement accuracy.
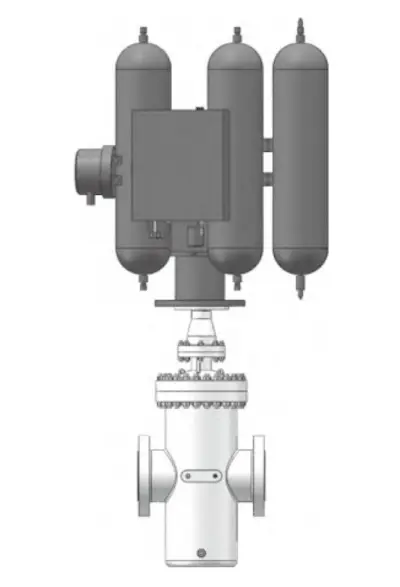
Figure 1 Three-dimensional model of the gate valve
The control equations employ the Reynolds-averaged Navier-Stokes (RANS) equations for viscous and incompressible flow. For computational efficiency, the boundary velocity is set to 10 m/s, the outlet pressure to 0.1 MPa, and the fluid medium is clean water at room temperature. The pipeline wall is modeled as a no-slip boundary, while the mesh uses triangular nonlinear structural elements with local refinement around the gate area. Adaptive grid technology is employed to further refine the flow field, ensuring a more accurate simulation of the flow state.
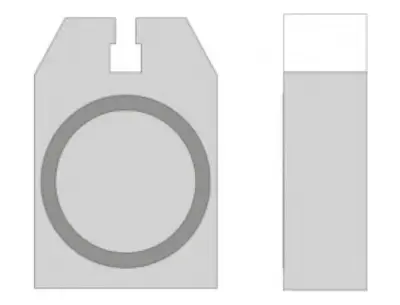
Figure 2 Design of the plate before improvement (single structure)
A pressure distribution cloud diagram of the fluid flow through the valve in its fully open state was generated using finite element analysis, as shown in Figure 3. The results indicate that the pressure difference between the upstream and downstream sides of the gate valve decreases significantly when fully open. The outlet pressure returns to its expected level within a short distance downstream of the valve. Furthermore, because of the incompressible nature of the fluid, the average flow velocity before and after the valve remains stable, and the throttling effect is mitigated.
However, the gate, located within the valve body cavity and subjected to fluid flushing, is supported only by the valve stem without additional support. As shown in Figure 3, a significant pressure difference exists between the gate and the outlet within the body cavity. This pressure acts on the gate's sealing surface, causing sealing pressure failure during valve closure and resulting in leakage. Additionally, the large gap between the front and rear ends of the gate allows fluid impact to cause gate oscillation, leading to a shift in valve concentricity and increasing the likelihood of leakage.

Figure 3 Gate pressure distribution cloud diagram before improvement
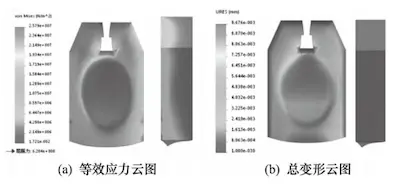
The flow field pressure is imposed on the solid structure to generate the equivalent stress and total deformation distribution diagrams of the gate, as shown in Figure 4. The maximum equivalent stress is observed on both sides of the gate, corresponding to the extrusion effect from fluid flow. Gate deformation causes separation from the valve seat, resulting in sealing pressure failure and leakage.
The total deformation distribution diagram shows significant deformation at the lower portion of the gate, caused by the positive fluid impact at the inlet. In contrast, the minimal deformation at the upper seal has negligible impact on overall performance.
(a) Equivalent stress cloud diagram (b) Total deformation cloud diagram
Figure 4 Improved front gate plate equivalent stress cloud map and total deformation cloud map
Figure 4 illustrates the equivalent stress and total deformation cloud diagrams of the gate prior to improvement. After the improvement, the gate assembly comprises a main gate, an auxiliary gate, guide plates, S-shaped springs, screws, and other components, as shown in Figure 5. The main and auxiliary gates form a K-shaped structure at a specific angle. When the valve is closed, the force applied to the upper part of the gate causes the main and auxiliary gates to open outward, enhancing the sealing performance with increasing force.
The S-shaped spring prevents excessive stretching of the main and auxiliary gates, ensuring that the opening and closing torque remains consistent. Additionally, the pre-tightening force of the S-shaped spring ensures a tight fit between the main and auxiliary gates, creating an integrated structure that minimizes friction during continuous operation and reduces the risk of leakage.
Finite element analysis was conducted using the same approach, with results presented in Figure 6. The pressure distribution in the front and rear areas of the valve remains uniform. Compared to the pressure before the improvement, the pressure is significantly reduced, enabling more efficient fluid flow. As shown in Figure 6, the gate is fully immersed in the fluid flow. The guide plates on both sides of the gate substantially reduce the fluid pressure acting on it. Moreover, the guide plates stabilize the gate, while the S-shaped springs provide structural support. This design prevents structural vibrations induced by fluid flow during operation, ensuring stable valve performance.
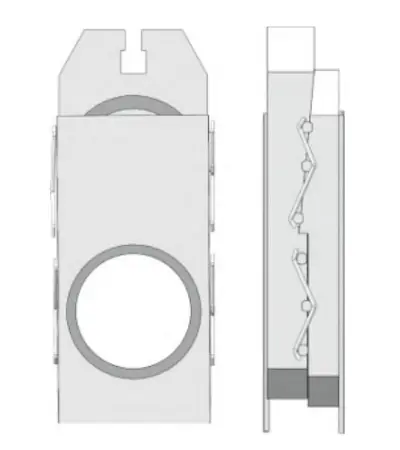
Figure 5 Improved plate (K-type combined structure)

Figure 6 Improved pressure distribution cloud diagramof the plate
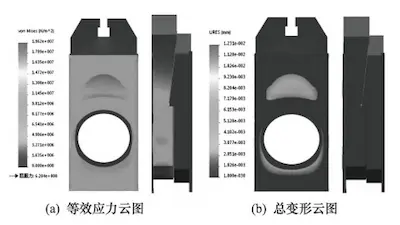
The improved gate applies the same method to translate flow field pressure into the solid model, producing equivalent stress and total deformation distribution diagrams, as shown in Figure 7. The equivalent stress concentrates on the guide plate, causing it to deform under high fluid pressure, while the gate shows minimal deformation. This deformation does not significantly affect the gate’s sealing performance.
The stress distribution in critical sections can be evaluated along the stress concentration areas using homogenization and equivalent linearization methods. In terms of total deformation, the gate’s integrated structure ensures favorable force characteristics, with deformation decreasing linearly. Although the upper end of the guide plate shows slight deformation, the overall effect remains minimal. The results show that the improved gate displays significantly enhanced performance in terms of structural strength and sealing.
(a) Equivalent stress cloud diagram (b) Total deformation cloud diagram
Figure 7 Equivalent stress cloud diagram and total deformation cloud diagram of the plate after improvement
The project team employed a lifecycle testing machine to verify the valve’s sealing performance. The lifecycle testing machine consists of a pressure loading system, a human-machine interface, a test control system, and the valve being tested. Parameters such as the number of tests, opening and closing angles, test duration, and fluid medium were specified. The test bench operated the oil cylinder to apply the specified pressure and monitored pressure changes during testing. Over 100 tests were conducted on the gate valve before and after the improvement. Monitoring data indicated changes in pressure across the valve, accompanied by an increase in opening and closing torque.
As shown in Figure 8, the results revealed leakage in the gate valve, with negligible change in opening and closing torque after the improvement. The pressure differential across the valve remained stable. Figure 9 shows no leakage in the gate valve, confirming alignment with the finite element analysis.
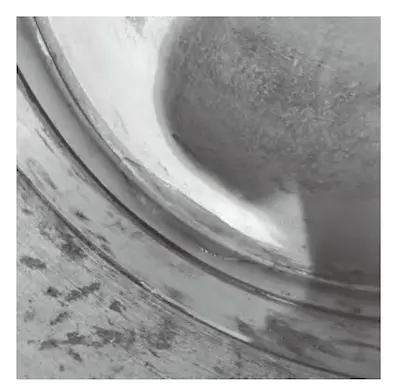
Figure 8 Test results of the experimental valve before improvement
The sealing performance of the DN300 slab gate valve (900LB class) was analyzed and optimized through a combination of finite element analysis and experimental testing. The results indicate a significant improvement in the sealing performance of the valve following the modifications. Prior to the modifications, the single gate plate was subjected to high fluid pressure, leading to material yield, deformation, and sealing failure. To address this, a combined structure was designed for the gate plate, incorporating a guide plate and an S-type spring to mitigate excessive fluid pressure and prevent sealing failure, ensuring reliable valve performance.
The analysis demonstrated that the sealing failures observed in the finite element analysis and testing, both before and after the modifications, align with the improvements achieved in sealing performance. This confirms the method’s effectiveness. The results provide key insights for optimizing gate plate structures to enhance sealing performance and serve as a reference for the design of similar pipeline components.
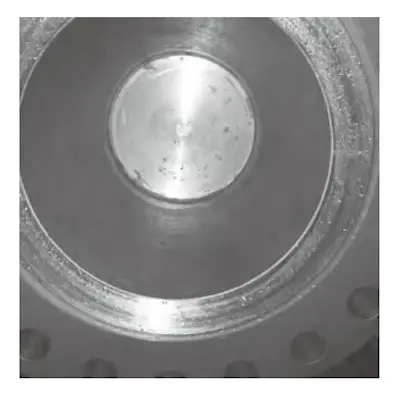
Figure 9 Test results of the experimental valve after improvement
Previous: Use of Ceramic Control Valves in Evaporated Ammonia Lime Milk Systems
Next: Hydrogen Corrosion in High-Pressure Hydrogenation Gate Valves

